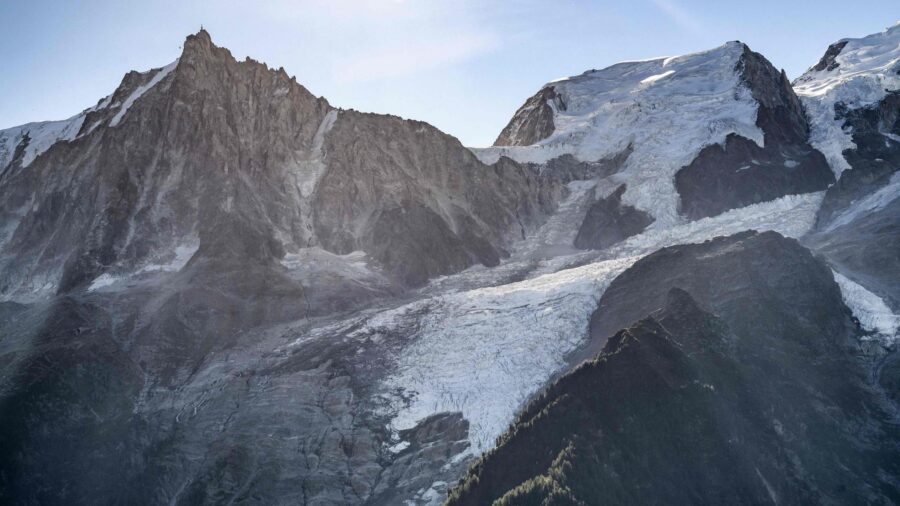
An interactive world map released by researchers v. Sperber and v. Liebe illustrates how each glacier may respond to different climate pathways.
Current status
The map shows the present extent of glaciers worldwide, confirming that most are already retreating due to rising temperatures.
Low‑emission scenario
Under a scenario that limits global warming to 1.5°C, the projection indicates a slower rate of ice loss. Some smaller glaciers could persist beyond mid‑century, while larger ice bodies would still shrink markedly.
High‑emission scenario
In a pathway where emissions continue unabated, the model predicts rapid disappearance of many glaciers within decades. The map marks numerous ice caps as likely to vanish before 2050.
Regional variations
Projections differ by region. Alpine glaciers show earlier decline, whereas some high‑latitude ice fields retain mass longer, though all are projected to lose volume.
Outlook
The tool underscores that glacier survival hinges on future emissions. It offers a visual reference for policymakers and the public on the timeline of ice loss under varying climate actions.